
Digital Signal Processing in Pine Script™, by Alex Grover
Table of Contents
- Introduction
- Digital Signals
- Convolution
- Transient Responses
- FIR Filter Design In Pine Script
- Gaussian FIR Filter
- Windowed Sinc FIR Filter
- IIR Filter Design In Pine Script
- Butterworth IIR Filter
- Gaussian IIR Filter
- Rolling Signal To Noise Ratio
- Rolling Noise Factor
- Generating White Noise
- Estimating Signals Period
- Tips And Tricks
- References
- About The Author
Introduction
Pine Script is a really lightweight scripting language but it allows for the computation of basic signal processing processes. In this guide, basic techniques and tools used in signal processing are showcased alongside their implementation in Pine Script. It is recommended to know the basics of Pine Script before reading this guide. Start here if you don’t.
Note that this guide is not intended to be an introduction to digital signal processing, even if some short definitions are shared.
Digital Signals
A digital signal is simply a sequence of values (samples) expressing a quantity that varies with time. When using Pine Script, you’ll mostly be processing market prices as your main signal. However it is possible to process/generate a wide variety of digital signals with Pine Script.
Periodic Signals
A periodic signal is a signal that repeats itself after some time. The image below shows a few different periodic signals:

Periodic signals possess characteristics such as : frequency, period, amplitude and phase. The frequency is the number of cycles made by the signal per unit of time (here samples), the period represents the duration in samples of one cycle and is the reciprocal of the frequency 1/frequency, the amplitude is the highest absolute value of the signal and finally the phase is related to the position of the signal in the cycle, the phase is commonly expressed in degrees/radians.
Sine Wave
The simplest periodic signal is the sine wave. The function is computed in Pine Script as follows:
sinewave(period,amplitude,phase)=>
    pi = 3.14159265359
    ph = phase/360*period
    n = bar_index-ph
    sin(2*pi*n/period)*amplitude
As a reminder,
bar_indexis defined as the current number ofclosedata points and is just a linear series of values equal to 0, 1, 2, 3, …
Triangular Wave
A triangular wave function is computed in Pine Script as follows:
triangle(period,amplitude,phase)=>
    pi = 3.14159265359
    ph = phase/360*period
    n = bar_index-ph
    2/pi*asin(sin(2*pi*n/period))*amplitude
Square Wave
A square wave function is computed in Pine Script as follows:
square(period,amplitude,phase)=>
    pi = 3.14159265359
    ph = phase/360*period
    n = bar_index-ph
    sign(sin(2*pi*n/period))*amplitude
sign(x)is the signum function and outputs1whenx > 0and-1whenx < 0.
Sawtooth Wave
A sawtooth wave function is computed in Pine Script as follows:
saw(period,amplitude,phase)=>
    pi = 3.14159265359
    ph = phase/360*period
    n = bar_index-ph
    2/pi*atan(tan(2*pi*n/(2*period)))*amplitude
or:
saw(period,amplitude)=>
    n = bar_index
    saw = n%period/period*amplitude
    (saw-.5)*2
This would output a linearly increasing sawtooth, which is why such a wave is sometimes called sawtooth-up. A sawtooth-down wave can simply be made by multiplying the sawtooth-up wave by -1, that is amplitude = -1.
Note that alternatives calculations exist in order to compute those signals. Here trigonometric forms are mostly used as they allow to change the phase of the signal.
Transient Signals
Transient signals are signals that show a sudden change in their values, they are extremely important and commonly used when studying the characteristics of discrete systems.
Systems are defined as processes that take an input and return an output.
Unit Impulse
The first transient signal presented is the unit impulse. A unit impulse is simply a signal equal to 0 except at one point where it is equal to 1. The unit impulse is made from the unit impulse function, also called Dirac delta function denoted δ(x) and outputs 1 when x = 0 and 0 otherwise.

The unit impulse is computed as follows:
n = bar_index
impulse = n == 0 ? 1 : 0
A more convenient alternative would be the Kronecker delta function which can define the position in time of the impulse, that is the Kronecker delta function is just a shifted Dirac delta function. The Kronecker delta is computed as follows:
n = bar_index
impulse = n == k ? 1 : 0
where k is the position in time of the impulse.
Unit Step
Another commonly used transient signal is the unit step signal calculated from the unit step function also called Heavyside step function.

The unit step is computed as follows:
n = bar_index
step = n >= 0 ? 1 : 0
However this would simply be like using step = 1, as bar_index does not have negative values. Therefore we can define the position of the step by using :
n = bar_index
step = n >= k ? 1 : 0
An unit step is simply the cumulative sum of an unit impulse, that is step = cum(impulse) and therefore an unit impulse is the 1st difference of an unit step, that is impulse = change(step).
Convolution
Convolution is one of the most important concepts in signal processing. Basically, convolution is a combination of two signals that outputs a third signal. The convolution is mathematically denoted by the • symbol, not to be confused with the multiplication symbol in programming.
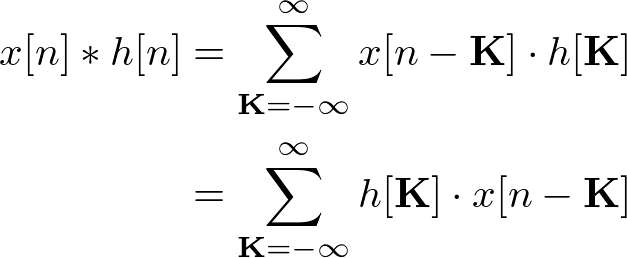
One can think of convolution as a sliding dot-product, or alternatively as a weighted rolling sum. In Pine Script convolution would be computed as follows :
sum = 0.
for i = 0 to length-1
  sum := x[i]*h[i]
which in this case is equivalent to sum(x*h,length). Certain moving averages are made by using convolution.
Transient Responses
The transient response of a system is the output of a system using a transient signal as input. Two common types of transient responses are the impulse response and step response.
Impulse Response
As its name suggests, the impulse response of a system is the output of a system using a unit impulse as input. If a system convolves a signal with a unit impulse, the impulse response will be equal to the original signal. The impulse response of a system is computed as follows:
n = bar_index
impulse = n == k ? 1 : 0
response = f(impulse)
Where f denotes a system function. For example the impulse response of a simple moving average would be sma(impulse,length).
Step Response
The step response of a system is the output of a system using a unit step as its input. The step response of a system is computed as follows:
n = bar_index
step = n >= k ? 1 : 0
response = f(impulse)
The step response of a simple moving average would be sma(step,length).
Impulse-Step Response Equivalence
As mentioned in the transient signals section, the cumulative sum of a unit impulse gives a unit step. This is also true for their response, that is the step response of a system is the cumulative sum of the system’s impulse response, and the impulse response of a system is the 1st difference of the system’s step response.
ImpulseResponse = change(f(step))

StepResponse = cum(f(impulse))
This is extremely useful if one wants to use both impulse and step responses in a same script as it allows having only a unit impulse instead of a unit impulse + a unit step in the script. It also avoids using a system twice, which can be extremely inefficient. In case one only wants to switch from the impulse response to the step response, it is easier to just replace n == k ? 1 : 0 with n > k ? 1 : 0.
FIR Filter Design In Pine Script
Filters allow us to modify the frequency content of a signal (see Fourier transform/decomposition) by removing/attenuating unwanted frequencies from the input signal. Certain filters can also amplify specific frequencies in the signal.
FIR filters are a class of filters that are calculated by using convolution. “FIR” stand for “finite impulse response”, which means that the filter’s impulse response will go back to steady-state, that is to 0, and will remain equal to 0. Because Pine Script can perform convolution it is possible to design a wide variety of FIR filters.
A FIR filter filter(input) is equal to input * filter(impulse) where * denotes convolution. Simply put, a filter output using a certain input is the convolution between the input and the filter’s impulse response.
In Pine Script you can make FIR filters by using:
filter(input) =>
    sum = 0.
    for i = 0 to length-1
        sum := sum + input[i] * h[i]
    sum
where length is the filter length, and will often control the filtering amount. The h[i] values are the filter coefficients (also called weights), a term used to describe an entire set of coefficients is “kernel”. However in Pine Script h will mostly denote an operation or a function of i.
The coefficients fully describe the time domain properties of the filter, such as smoothness and lag, and can give hints on the filter properties in the frequency domain. When we want to know how the filter interacts with the frequency content of the signal, however, we look at its frequency response, which for FIR filters is the Fourier transform of the impulse response.
There exist several types of filters that modify the frequency content of an input signal in different ways, each one of them will be introduced in this section, and we will learn how to create them in Pine Script.
FIR Low-Pass Filters Design

Low-pass filters are used to remove/attenuate higher frequencies of an input signal, which leads to a smooth output. In technical analysis, moving averages are low-pass filters. The simplest low-pass filter is the simple (arithmetic) moving average, which convolves the input signal with a constant, that is the filter coefficients of a simple moving average are all equal to 1/length where length is the filter length. In Pine Script the most efficient way to compute a simple moving average is by using the built-in sma function.
The simple moving average using convolution is computed as follows:
ma = 0.
for i = 0 to length-1
    ma := ma + input[i] * 1/length
Note however that in a loop, we repeat each operation n times, where n is the number of loop iterations. If a loop is required, it is therefore more efficient to use:
sum = 0.
for i = 0 to length-1
    sum := sum + input[i]
ma = sum/length
The sum of the coefficients of a low-pass filter must be equal to 1, this allows to have passband unity. If the sum of the coefficients is greater than 1, the filter passband will be superior to 1, which will give an output greater than the input signal. However if the sum of the coefficients is inferior to 1 and superior to 0, then the output will be lower than the input signal. The coefficients of a simple moving average already add up to 1, but what if we use other coefficients that do not? In this case we must normalize the convolution with the sum of the coefficients (sometimes called normalizing constant). This is done in pine as follows:
sum = 0.,sumh = 0.
for i = 0 to length-1
    h = sin(i/length)
    sumh := sumh + h
    sum := sum + input[i]*h
lpfilter = sum/sumh
Here the sum of h is not equal to 1, but because we divide the convolution’s output by the sum of the coefficients (sumh in the script), we can achieve a filter with a unit passband.
It is not possible to design FIR filters precisely with Pine Script, as the necessary tools are not available, however since the characteristics of a filter are described by its coefficients, we can roughly get an idea on how a FIR filter might process an input signal. Below is a short guide on the relationship between filter characteristics and filter coefficients.
-
A filter will be smooth if its impulse response is relatively symmetrical, with mostly positive values, and not too wide nor to sharp. Wide impulse responses will return an output similar to a simple moving average, while sharp impulse responses will return an approximation of an impulse and the filter could just return a shifted version of the input signal.
-
The lag of a filter depends on the coefficients attributed to the current and past inputs of the signal. A filter attributing the highest coefficients to more recent input values will have a lower lag than a filter attributing the highest coefficients to oldest input values.
-
Lag is drastically reduced when the coefficients of the filter include negative values, this is because negative coefficients would amplify frequencies in the filter passband. Input values receiving negative coefficients should be the oldest ones, and the sum of the positive coefficients should be greater than the absolute sum of negative coefficients.
-
If a function
f(x)is equal to 0 whenx = 1, then using its 1st difference as the filter’s kernel would leave a unit passband and there would be no need to normalize the convolution.
We can easily create all the other types of filters by using low-pass filters. They are therefore extremely useful.
FIR High-Pass Filters Design
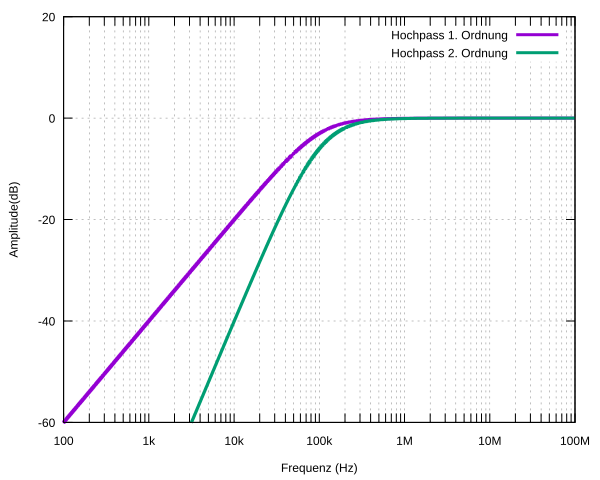
High-pass filters are used to remove/attenuate lower frequencies of an input signal. They perform the contrary operation of low-pass filters. The sum of the coefficients of a high-pass filter with passband unity is equal to 0, with a majority of coeffecients being negative most of the time.
The easiest way to design high-pass filters is by simply subtracting a low-pass filter from the input signal: highpass = input - lowpass(input). For example, the high-pass version of a simple moving average would be made as follows:
hpsma = input - sma(input,length)
Another way of designing FIR high-pass filters is by modifying the coefficients of a low-pass filter by using a process called “spectral inversion”, which consists in changing the sign of all the filter coefficients (that is multiplying each coefficient by -1) and by adding 1 to the first coefficient. For example, spectral inversion using a simple moving average is done as follows:
hpma = 0.
for i = 0 to length-1
    inv = 1/length * -1
    h = i == 0 ? inv+1 : inv
    hpma := hpma + input[i] * h
with inv representing the inverted coefficients, and with h adding 1 to the first inverted coefficient. Make sure the sum of the non-inverted coefficients is equal to 1 in the first place.
The impulse response of a high-pass filter is equal to impulse - lowpass(impulse) where lowpass is the low-pass version of the high-pass filter, and its step response is equal to 1 minus the step response of its low-pass version.
FIR Band-Pass Filters Design

Band-pass filters are used to remove/attenuate lower and higher frequencies of an input signal. They therefore perform the operation of low-pass and high-pass filters simultaneously. The sum of the coefficients of a band-pass filter with passband unity is like a high-pass filter equal to 0, however while most of the coefficients of a high-pass filters are negative, band-pass filters generally have the same number of negative and positive coefficients.
The easiest way to design band-pass filters is by simply applying a low-pass filter to a high-pass filter, therefore bandpass = lowpass(highpass(input)). The band-pass version of a simple moving average can be made as follows:
bpsma = sma(input - sma(input,length),length)
Symmetrical signals in a range of [-1,1] are great choices of kernels for band-pass filters. Another option is to use the 1st difference of a low-pass filter kernel in order to produce a band-pass filter kernel. In order to do so, check the formula you are using to generate the coefficients of the low-pass filter, then get the formula’s derivative. This method mostly works with increasing/decreasing symmetrical kernels.
The impulse response of a band-pass filter is equal to the convolution between the low-pass and high-pass impulses responses, that is: cum(lowpass(impulse)*highpass(impulse)), and the step response would be equal to the cumulative sum of the band-pass filter’s impulse response.
FIR Band-Stop Filters Design

Band-stop filters, also called band-reject or notch filters, are used to remove/attenuate frequencies in a specific range of the input signal while preserving higher/lower frequencies. They perform the contrary operation of band-pass filters. The sum of the coefficients of a band-stop filter with passband unity is equal to 1.
The easiest way to design band-stop filters is by simply subtracting a band-pass filter from the input signal: bandstop = input - bandpass(input). The band-stop version of a simple moving average can be made as follows:
bssma = input - sma(input - sma(input,length),length)
Another way of designing FIR band-stop filters is by modifying the coefficients of a band-pass filter by using spectral inversion, which was used for designing FIR high-pass filters from the kernel of a FIR low-pass filter. For band-stop filter the process is the same, however we modify the coefficients of a FIR band-pass filter instead of a FIR low-pass filter.
The impulse response of a band-stop filter is equal to impulse + bandpass(impulse)*-1 where bandpass is the band-pass version of the band-stop filter, and its step response is equal to 1 minus the step response of its band-pass version.
Windowing And Window Functions
Windowing (sometimes called kernel tapering) is a process that allows to enhance the performance of a FIR filter in the frequency domain. Windowing allows removing ripples in the pass/stop-band of the filter frequency response which yields a greater attenuation of frequencies, thus creating a smoother output. Windowing can be used when the kernel of a FIR filter is non-periodic and/or has sharp borders (which is the cause of ripples). It will create a more periodic kernel and attenuate or eliminate its sharp borders.
Windowing simply consists of multiplying the filter kernel by a window function. In Pine Script, the general form of windowing would be done as follows :
filter(input) =>
    sum = 0.
    for i = 0 to length-1
        sum := sum + h[i]*w(i)*input[i]
    sum
where w(i) is a windowing function with argument i. There exists a wide variety of windowing functions, which can also be used as kernels for low-pass filters. The most notable ones will be described and their calculation shown below.
Blackman Window
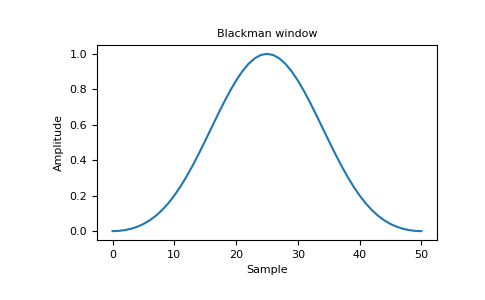
The Blackman window is a window with a symmetrical shape consisting on the sum of 2 cosine waves. In Pine Script the function of a Blackman window can be computed follows:
blackman(x) =>
    pi = 3.14159
    0.42 - 0.5 * cos(2 * pi * x/(length-1)) + 0.08 * cos(4 * pi * x/(length-1))
Where length is the filter length.
Bartlett Window
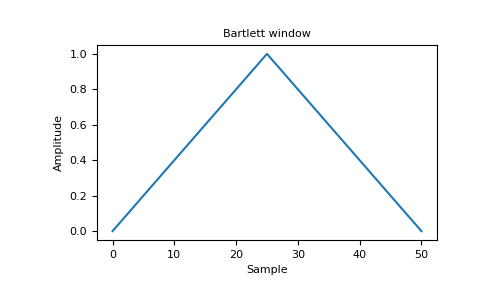
The Bartlett window, also called triangular window is a window with a triangular shape. In Pine Script the function of a Bartlett window can be computed follows:
bartlett(x) =>
    pi = 3.14159
    1 - 2*abs(x - (length-1)/2)/(length-1)
The convolution between an input signal and a Bartlett function is the same as applying a simple moving average twice sma(sma(...)).
Hann Window
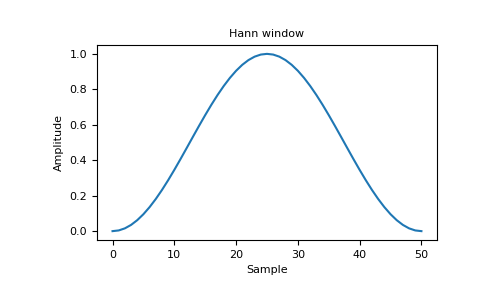
The Hann window, also called Hanning window is similar to the Blackman window but is wider. In Pine Script the function of an Hann window can be computed follows:
hann(x) =>
    pi = 3.14159
    0.5 - 0.5 * cos(2 * pi * x/(length-1))
Windowing Template
In order to easily apply windowing to your FIR filter, you can use the following template which includes all the previously mentioned windows:
length = input(100),src = input(close)
window = input("None",options=["Bartlett","Blackman","Hanning","None"])
//----
pi = 3.14159
a(x) => 1 - 2*abs(x - (length-1)/2)/(length-1)
b(x) => 0.42 - 0.5 * cos(2 * pi * x/(length-1)) + 0.08 * cos(4 * pi * x/(length-1))
c(x) => 0.5 - 0.5 * cos(2 * pi * x/(length-1))
//----
f(x,y,z) => window == x ? y : z
win(x) => f("Bartlett",a(x),f("Blackman",b(x),f("Hanning",c(x),1)))
//----
sumw = 0.,sum = 0.
for i = 0 to length-1
    h =
    w = win(i)*h
    sumw := sumw + w
    sum := sum + src[i]*w
filter = sum/sumw
All you need to do is to put the calculation generating your filter coefficients in h.
Gaussian FIR Filter

A gaussian filter is a filter using a gaussian function as kernel, the gaussian function is characterized by its symmetrical bell shaped curve and has many properties that make the gaussian filter extremely useful in certain situations.
The gaussian function is described by the following formula:

where σ is the standard deviation parameter and controls the width of the curve at lower values. However a gaussian function is infinitely long and never reaches 0. Therefore using it as filter kernel is theoretically impossible, which is why the function is first truncated then used as filter kernel.
The simplest way to implement a gaussian filter is based on multiple applications of a simple moving average, the resulting impulse response would approximate a gaussian function, however this approach can be extremely inefficient. Another way is by using the function alma(series, length, offset, sigma) with offset = 0.5, however the filter impulse response is nonsymmetric when using an even filter length.
A gaussian filter with symmetrical impulse response can be computed in Pine Script as follows:
length = input(100),src = input(close),width = input(2)
//----
sum = 0.,sumh = 0.
for i = 0 to length-1
    x = -length + 1 + i*2
    h = exp(-.5*pow(width/length*x,2))
    sumh := sumh + h
    sum := sum + src[i] * h
gauss = sum/sumh
Windowed Sinc FIR Filter

The windowed sinc filter is a filter that tries to approximate an ideal frequency response, that is a filter which would only remove or keep frequencies in the signal, but would not attenuate them. A sinc filter uses a sinc function as its filter kernel, but like the gaussian filter, such functions must be infinite in order for the filter to return an ideal frequency response. Because this is impossible with FIR filters, the sinc function is truncated.
In order to minimize the effects of truncation, windowing is applied (the truncated sinc function is multiplied by a window function), hence the name windowed sinc filter.
A windowed sinc filter with a custom window is computed in Pine Script as follows:
length = input(100),src = input(close),cm = input(1,"Cut-Off Multiplier")
window = input("None",options=["Bartlett","Blackman","Hanning","None"])
//----
pi = 3.14159
a(x) => 1 - 2*abs(x - (length-1)/2)/(length-1)
b(x) => 0.42 - 0.5 * cos(2 * pi * x/(length-1)) + 0.08 * cos(4 * pi * x/(length-1))
c(x) => 0.5 - 0.5 * cos(2 * pi * x/(length-1))
//----
f(x,y,z) => window == x ? y : z
win(x) => f("Bartlett",a(x),f("Blackman",b(x),f("Hanning",c(x),1)))
//----
cf = 1/length*cm
sumw = 0.,sum = 0.
for i = 0 to length-1
    x = i - (length-1)/2
    sinc = sin(2*pi*cf*x)/(pi*x)
    w = nz(sinc,2*cf)*win(i)
    sumw := sumw + w
    sum := sum + src[i]*w
filter = sum/sumw
The cut-off multiplier cm determines the number of local maxima/minima in the sinc function, more precisely n = 2*cm - 1 where n is the number of local maxima/minima.
IIR Filter Design In Pine Script
Unlike FIR filters which have an impulse response returning to steady state, IIR (infinite impulse response) filters have an infinitely long impulse response. IIR filters are also based on a weighted sum, however they use recursion, which means they use past outputs values as input. The use of recursion allow for extremely efficient filters, which was one of the downsides of FIR filters which require a high number of operations with larger filtering amounts (higher length). This is not the case with IIR filters.
In Pine Script an IIR filter can be made as follows:
y = 0.
y := b0*input+b1*input[1]...+a0*nz(y[1])+a1*nz(y[2])...
The coefficients that affect the input values (all b-prefixed variables in the code) are called feed-forward coefficients, while the coefficients affecting past outputs values (all a-prefixed) are called feedback coefficients. The function nz outputs a user-selected value (0 by default) when the input is na. This function is useful to initialize the IIR filter. Recursive inputs are generally initialized to 0. In this case we can rewrite the above code more efficiently with:
y = 0.
y := b0*input+b1*input[1]...+nz(a0*y[1]+a1*y[2]...)
It is also common to use the input signal or a moving average to initialize an IIR filter.
Simple IIR Design Techniques
Designing IIR filters is way more complicated than FIR ones, as the feed-forward and feedback coefficients needs to be precisely calculated in order to return a desired output. For an IIR low-pass filter with no overshoots, the sum of coefficients needs to be equal to 1 in order to have passband unity, however unlike FIR filters, if the sum of the IIR filter’s coefficients is greater than 1, the filter won’t be stable. A simple way to make our IIR filter stable is by using a normalizing constant, for example:
b0 = 4,b1 = 5
a0 = 9,a1 = 10
norm = a0+a1+b0+b1

y = 0.
y := (b0*input+b1*input[1]+nz(a0*y[1]+a1*y[2]))/norm
Here the sum of the coefficients (norm in the code) is greater than 1, however since we divide the weighted sum by the sum of the coefficients, we obtain a filter with passband unity. The simplest IIR low-pass filter is the exponential moving average (sometimes called exponential filter) and is equivalent to a simple moving average. In Pine Script an exponential moving average can be computed using the ema function, however we can also compute it as follows:
ema = 0.
alpha = 2/(length+1)
ema := alpha*input+(1-alpha)*nz(ema[1],src)
where length is greater than 1 and defined by the user. Higher values of length give a greater weight to the past output, thus making the filter return a smoother output, therefore feedback coefficients higher than the feed-forward coefficients will return a larger filtering amount. Here no normalizing constant is needed, as alpha + (1-alpha) = 1. Another way to compute an exponential moving average is done as follows:
ema = 0.
alpha = 2/(length+1)
ema := nz(ema[1],src) + alpha*nz(src-ema[1])
Different types of IIR filters can be constructed using the same techniques mentioned in the FIR filter section, that is:
IIR_highpass = input - IIR_lowpass(input)IIR_bandpass = IIR_lowpass(IIR_highpass))IIR_bandreject = input - IIR_bandpass
All you need is the low-pass filter.
Butterworth IIR Filter

The Butterworth filter is extremely popular because of its high-frequency domain performances, the filter has no overshoots/undershoots and has a flat magnitude response. Some Butterworth filters with a different number of poles where described by Elhers [1] and are already available in the Pine Script repository.
Alarcon, Guy and Binnie also proposed a simple 3-pole Butterworth filter [2], their design is computed in Pine Script as follows:
length = input(14),src = input(close)
//----
cf = 2*tan(2*3.14159*(1/length)/2)
a0 = 8 + 8*cf + 4*pow(cf,2) + pow(cf,3)
a1 = -24 - 8*cf + 4*pow(cf,2) + 3*pow(cf,3)
a2 = 24 - 8*cf - 4*pow(cf,2) + 3*pow(cf,3)
a3 = -8 + 8*cf - 4*pow(cf,2) + pow(cf,3)
//----
c = pow(cf,3)/a0
d0 = -a1/a0
d1 = -a2/a0
d2 = -a3/a0
//----
out = 0.
out := nz(c*(src + src[3]) + 3*c*(src[1] + src[2]) + d0*out[1] + d1*out[2] + d2*out[3],src)
Gaussian IIR Filter
Many recursive implementations of the Gaussian filter exist and are way more efficient than their FIR counterparts. Unfortunately, they rely on forward-backward filtering in order to provide a symmetrical gaussian impulse response, which cannot be implemented in Pine Script. Some alternatives exist, the most notable one being the Gaussian filter described by Elhers [3], which is based on the multiple applications of exponential moving averages, this filter is available in the Pine Script repository.
Rolling Signal To Noise Ratio
The signal to noise ratio (SNR) is used to measure the level of a signal relative to the level of unwanted noise, with a SNR inferior to 1 indicating more noise than signal. This metric is often expressed as the ratio of the mean and the standard deviation, however a rolling version could be more useful. The signal to noise ratio function can be computed in Pine Script as follows:
snr(input,length) => sma(input,length)/stdev(input,length)
Rolling Noise Factor
The noise factor is a measurement that makes use of the previously described signal to noise ratio and is defined as the ratio between the SNR of an input signal and the SNR of a system output. The rolling noise factor of a simple moving average can be computed in Pine Script as follows:
ma = sma(input,length)
snrin = snr(input)
snrout = snr(ma)
nf = snrin/snrout
Generating White Noise
White noise is a type of random signal that has a constant power spectral density with no auto-correlation. Randomness can’t be programmed, and therefore we can only use pseudo-random number generators in order to approximate white noise. A white noise generator function with uniform distribution and 0 mean can be computed in Pine Script as follows :
lcg(seed) =>
    s = (171 * nz(s[1],seed))%30269
    (s/30269 - .5)*2
where seed is a user-defined number. This generator is the classical linear congruential generator with no increment. In the case where we want normally-distributed white noise, we simply need to sum various white noise signals with a uniform distribution, that is:
normal = lcg(1) + lcg(2) + lcg(3) + ...
Estimating Signals Period
Periodic Signals
The main property of any periodic signal is that signal[n] == signal[n+period], we can use this property in order to find the period of a periodic signal.
period(input,range)=>
    p = range+1
    for i = 1 to range
        p := input == input[i] ? min(i,p) : p
where range is defined by the user. This function would find the period of a periodic signal and would return range+1 if range is to small, this function can also test if a signal is periodic.
Non Periodic Signals
It is possible to estimate the lowest period of a signal even if the signal is not perfectly periodic and without searching in a specific range of periods, this method is therefore faster than the previous one.
period(input)=>
    k = abs(change(sign(change(input))))/2
    round(bar_index*2/cum(k))
Tips And Tricks
-
Using
2*input - input[length/2]as the input for a low-pass filter with lengthlengthwill reduce the filter’s lag. - Using linear combinations of low-pass filters allows to reduce lag, for example:
k*lowpass(input,length/2) - (k-1)*lowpass(input,length)with higher values of
kfurther minimizing the filter’s lag. -
The derivative of sigmoid functions (S shaped curves) can be used for the filter’s kernel in order to create really smooth filters.
-
The derivative of a symmetrical bell shaped curve can be used for the filter’s kernel in order to create band-pass filters.
-
If a script uses a lot of simple moving averages, replace them with exponentially weighted ones as they are more efficient to compute.
-
A strategy using IIR filters should start after the filter transient (the first values of the filter).
- A simple moving average can be computed more efficiently using the following code:
sma = change(cum(input),length)/length - The difference between 2 filters can produce a band-pass filter as long as the first filter to be subtracted is more reactive than the other, for example:
bandpass = sma(input,length/2) - sma(input,length) - Measuring how spread out an input is from its low-pass filter can easily computed by using the naïve standard deviation.
dev = sqrt(filter(input*input) - pow(filter(input),2))
Note that a filter having negative coefficients (or low-lag in general) can produce na values.
References
[1] Ehlers, J. F. “POLES, ZEROS, and HIGHER ORDER FILTERS.” http://www.stockspotter.com/Files/polesandzeros.pdf
[2] Alarcon, G., C. N. Guy, and C. D. Binnie. “A simple algorithm for a digital three-pole Butterworth filter of arbitrary cut-off frequency: application to digital electroencephalography.” Journal of Neuroscience Methods 104.1 (2000): 35-44.
[3] Ehlers, J. F. “Gaussian and Other Low Lag Filters” https://www.mesasoftware.com/papers/GaussianFilters.pdf
About The Author

alexgrover is a member of the TradingView community specialized in the creation of technical trading tools using the Pine Script language. As a DSP enthusiast, he tries to explain many DSP concepts in an intuitive way to the TradingView community.
Thanks for reading ⊂( ・ω・)⊃